Graphical tools for CTBN
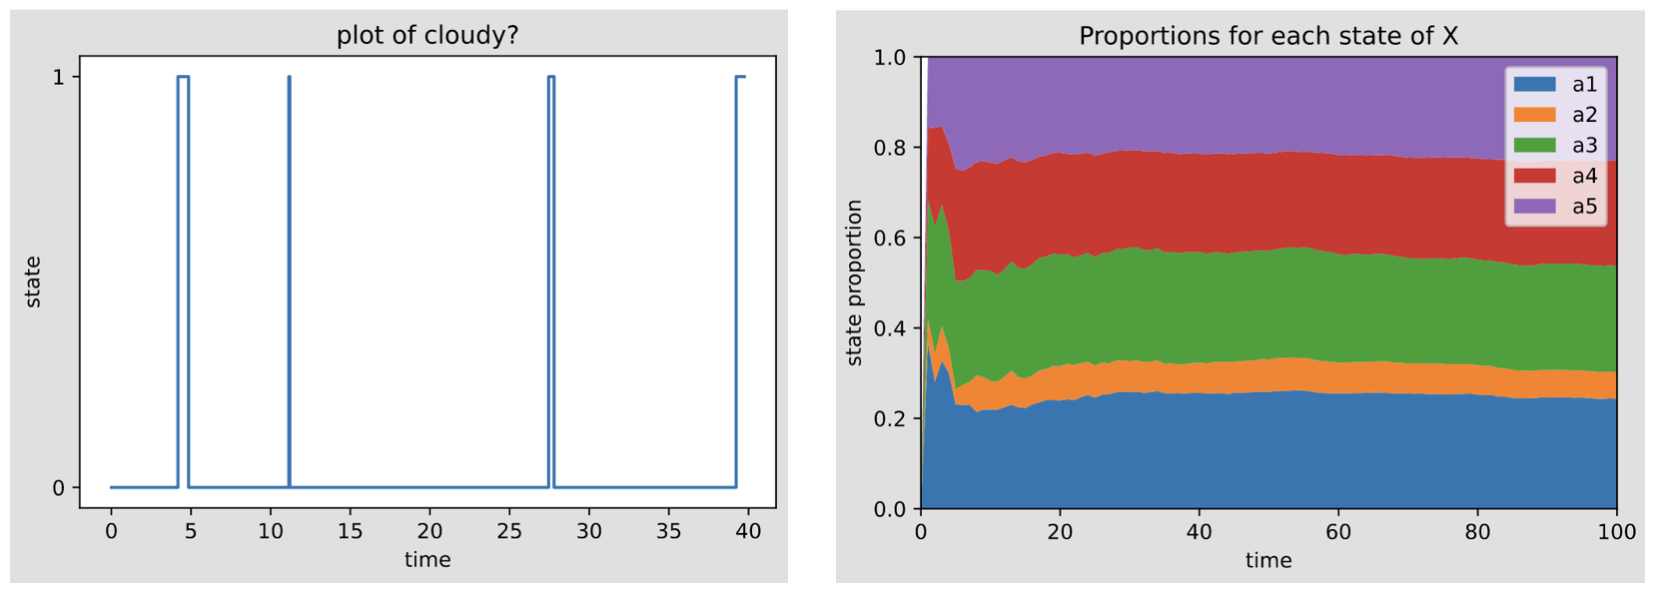
- pyagrum.ctbn.plotTrajectory(v, traj, timeHorizon=None, plotname=None)
Plot a variable’s trajectory using matplotlib.pyplot.
- Parameters:
v (
DiscreteVariable) – Variable to follow.traj (
list[tuple[float,str,str]]) – Trajectory to plot.timeHorizon (
float|None) – Maximum time length to show.plotname (
str|None) – Name of the plot.
- pyagrum.ctbn.plotFollowVar(v, trajectories, timeHorizon=None, N=None, plotname=None)
Plot the evolution (the proportions of the states the variable transition into) of a variable over time.
- Parameters:
v (
DiscreteVariable) – The variable to follow.trajectories (
dict[int,list[tuple[float,str,str]]]) – Contains trajectories. The result is a mean over all the trajectories.timeHorizon (
float|None) – Maximum time length to plot. If None, then the entire time length of the trajectories is used.N (
int|None) – Number of division of interval [0, timeHorizon].plotname (
str|None) – Name of the plot. If None, the picked name is “Proportions for each state of {v.name()}”.