import matplotlib_inline
matplotlib_inline.backend_inline.set_matplotlib_formats("png")
plt.rcParams["figure.figsize"] = [30, 3]
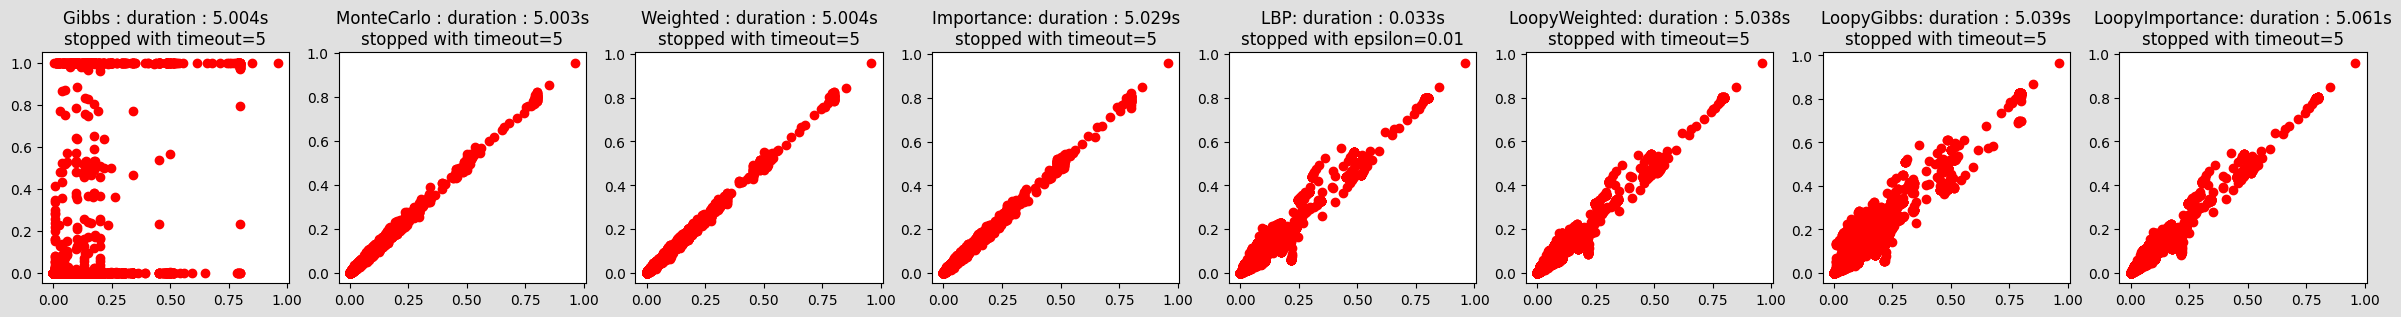
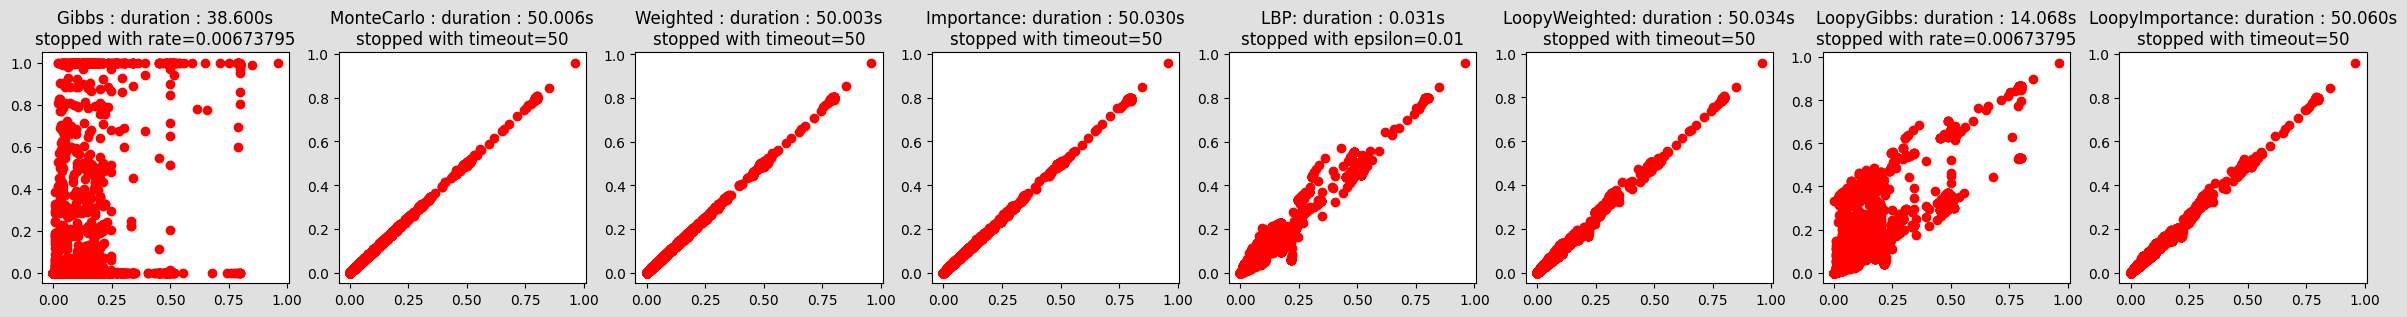
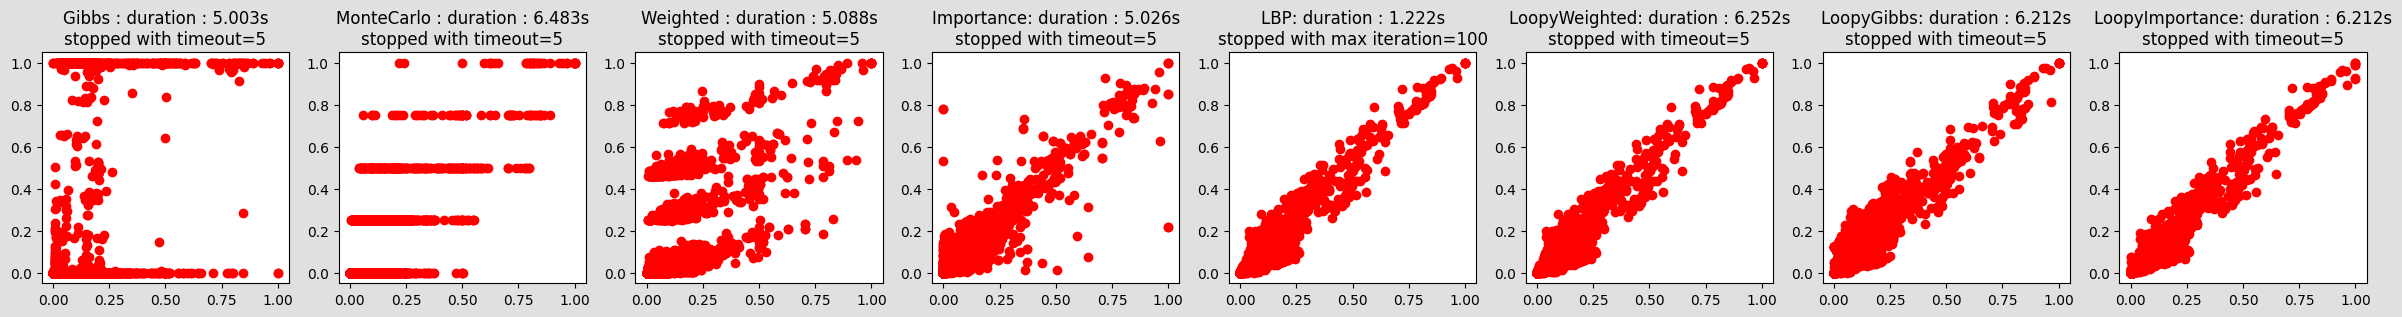
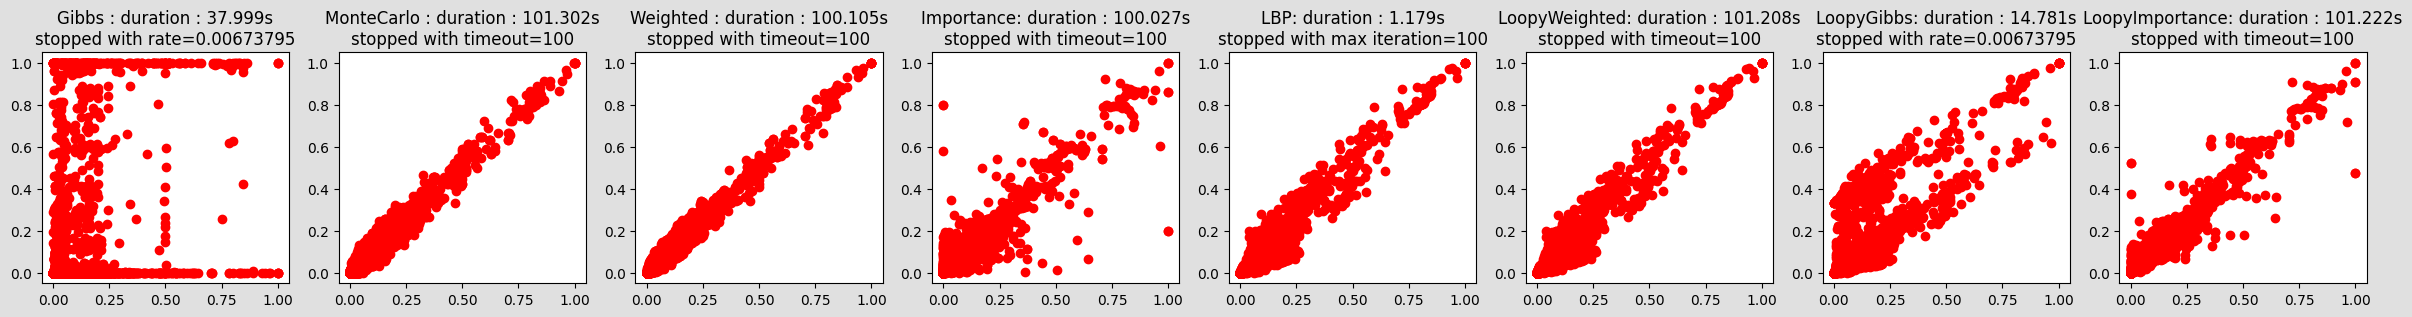
def compareIE(bn, maxtime, epsilon, evs=None):
ie = gum.LazyPropagation(bn)
if evs is not None:
ie.setEvidence(evs)
x = vals(bn, ie)
ie2 = gum.GibbsSampling(bn)
if evs is not None:
ie2.setEvidence(evs)
ie2.setMaxTime(maxtime)
ie2.setEpsilon(epsilon)
txt = "Gibbs : " + execute(ie2) + "\n" + ie2.messageApproximationScheme()
y = vals(bn, ie2)
plt.subplot(181)
plt.plot(x, y, "ro")
plt.title(txt)
ie3 = gum.MonteCarloSampling(bn)
if evs is not None:
ie3.setEvidence(evs)
ie3.setMaxTime(maxtime)
ie3.setEpsilon(epsilon)
txt = "MonteCarlo : " + execute(ie3) + "\n" + ie3.messageApproximationScheme()
y = vals(bn, ie3)
plt.subplot(182)
plt.plot(x, y, "ro")
plt.title(txt)
ie4 = gum.WeightedSampling(bn)
if evs is not None:
ie4.setEvidence(evs)
ie4.setMaxTime(maxtime)
ie4.setEpsilon(epsilon)
txt = "Weighted : " + execute(ie4) + "\n" + ie4.messageApproximationScheme()
y = vals(bn, ie4)
plt.subplot(183)
plt.plot(x, y, "ro")
plt.title(txt)
ie5 = gum.ImportanceSampling(bn)
if evs is not None:
ie5.setEvidence(evs)
ie5.setMaxTime(maxtime)
ie5.setEpsilon(epsilon)
txt = "Importance: " + execute(ie5) + "\n" + ie5.messageApproximationScheme()
y = vals(bn, ie5)
plt.subplot(184)
plt.plot(x, y, "ro")
plt.title(txt)
ie6 = gum.LoopyBeliefPropagation(bn)
if evs is not None:
ie6.setEvidence(evs)
ie6.setMaxTime(maxtime)
ie6.setEpsilon(epsilon)
txt = "LBP: " + execute(ie6) + "\n" + ie6.messageApproximationScheme()
y = vals(bn, ie6)
plt.subplot(185)
plt.plot(x, y, "ro")
plt.title(txt)
ie7 = gum.LoopyWeightedSampling(bn)
if evs is not None:
ie7.setEvidence(evs)
ie7.setMaxTime(maxtime)
ie7.setEpsilon(epsilon)
txt = "LoopyWeighted: " + execute(ie7) + "\n" + ie7.messageApproximationScheme()
y = vals(bn, ie7)
plt.subplot(186)
plt.plot(x, y, "ro")
plt.title(txt)
ie8 = gum.LoopyGibbsSampling(bn)
if evs is not None:
ie8.setEvidence(evs)
ie8.setMaxTime(maxtime)
ie8.setEpsilon(epsilon)
txt = "LoopyGibbs: " + execute(ie8) + "\n" + ie8.messageApproximationScheme()
y = vals(bn, ie8)
plt.subplot(187)
plt.plot(x, y, "ro")
plt.title(txt)
ie9 = gum.LoopyImportanceSampling(bn)
if evs is not None:
ie9.setEvidence(evs)
ie9.setMaxTime(maxtime)
ie9.setEpsilon(epsilon)
txt = "LoopyImportance: " + execute(ie9) + "\n" + ie9.messageApproximationScheme()
y = vals(bn, ie9)
plt.subplot(188)
plt.plot(x, y, "ro")
plt.title(txt)
plt.show()